Here’s Part II. No, wait: Here’s Part I. Read those first, there’ll be an open-book quiz.
We’re explaining what all these mutual fund risk measurements mean. Yes, you want to know how much your mutual fund has gained and might likely gain, but the professionals have collectively decided that you need to know not only your fund’s propensity for gain, but how risky said fund is. Thus they applied some formulae to price swings, creating α, β, R², σ (that’s a lowercase sigma, the equivalent of the Roman letter S, the first letter in “standard deviation”), and two other quantities that are named after people with Anglo-Saxon names and thus aren’t symbolized with a Greek letter:
Sharpe and Treynor ratios. What are they and do we care? Let’s answer the 1st question 1st.
William Sharpe is a 79-year-old Stanford professor and Nobel laureate. Decades ago, he tried to determine how much of a given investment’s returns are due to sagacity on the part of the investor, and how much are due to risk. If black 17 comes up and pays you 36-to-1, that means you’re 0% a shrewd roulette player, and 100% someone who benefitted from the inherent risk. The formula for the Sharpe ratio is relatively simple, so much so that it’s kind of amazing no one thought of it before the 1960s.
Start with the investment’s average rate of return, in this case over a 3-year period as indicated in the chart. Subtract the best available risk-free rate of return, like what you’d get from short-term government bonds – 10-year T-bonds, to be specific. Which, over the last few years, has been effectively zero. Then divide the difference by the standard deviation, which we explained Wednesday and which is a measure of how much monthly returns fluctuate with regard to the average. The theory goes that if you measure an investment by its excess return per unit of standard deviation, you’re focusing on how well the investment does on its own merits rather than how well it’s doing given its inherent risky nature.
The advantage of Sharpe ratio over α and β is that Sharpe ratio rates an investment on its own merits, rather than against a benchmark. The downside is that our denominator, standard deviation, can fluctuate for a host of reasons.
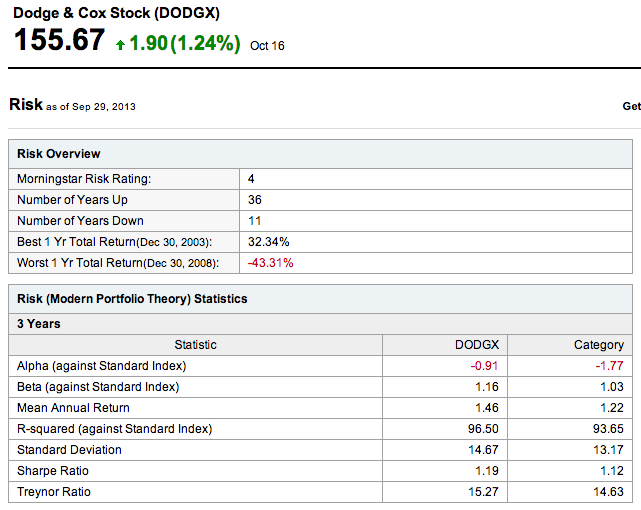
So what does a Sharpe ratio of 1.19 mean? Is it high, low? As always, it depends on the asset class. As you can read, Sharpe ratios in the Dodge & Cox Stock Fund’s asset class run around 1.12. DODGX beats the average by a few points, meaning that the data could be interpreted as evidence that DODGX’s managers are operating more on skill and less on luck than are their counterparts and competitors. T-bills have a Sharpe ratio of 0, and of course return less than T-bills’ means a negative Sharpe ratio. With time, as returns normalize, Sharpe ratios reduce. DODGX’s Sharpe ratio over the last 5 years is .59, and over the past decade .45.
Jack Treynor is a financial analyst with fewer academic credentials but almost certainly more money than William Sharpe. He developed his competing ratio a few years before Sharpe. Treynor ratio is identical to Sharpe ratio, except the former divides excess return (over T-bills) by β instead of by standard deviation. In other words, Treynor ratio measures returns with regard to market risk, instead of total risk. DODGX’s Treynor ratio is greater than the category’s Treynor ratio over the past 3 years. And the past 5 years, but not the past decade. Again, Treynor ratio compares returns with regard to volatility with respect to a benchmark. Neither Sharpe nor Treynor ratio has anything to say about how actively a fund or a portfolio is managed.
None of this is anything but mathematical masturbation. It’s dividing quantities by other quantities purely for the fun of it. As an investor, your objective is to make money. Not to beat benchmarks, nor to gauge your investments with regard to inherent and/or systemic risks. Most of the wealthiest people we know have no familiarity with any of these measurements, and wouldn’t see any reason for knowing how to calculate them.
You can choke on theory, or you can buy assets and sell liabilities. It really isn’t more complicated than that. The various risk measurements are nothing more than intellectual curiosities, the kind of stuff that the Nobel committee loves and that university business schools love even more. After all, it’s more material to add to the curriculum.
Furthermore, there’s a reason why every last piece of financial advice is punctuated with the following phrase: Past performance is not necessarily indicative of future results. α, β, R² etc. are incredibly helpful if you plan on traveling back in time and making investment decisions in the fall of 2010. In the market, there’s no better investment than a temporarily wounded stock. Until the academics learn how to quantify the implications of a Carnival Corporation ship capsizing or an iteration of Microsoft’s Windows 8 software being released with bugs, you’re better off looking for something undervalued and exercising patience.


